https://wiki.archlinux.org/index.php/QEMU_(%E7%AE%80%E4%BD%93%E4%B8%AD%E6%96%87)
Qemu: http://git.kernel.org/pub/scm/virt/kvm/qemu-kvm.git
http://wiki.qemu.org/Features/LegacyRemoval
Image
The base image for each container/VM is an Ubuntu 16.04 server image pulled from the LXD ubuntu: repository. The Qemu image was created by exporting the LXD image and extracting it into an ext4 filesystem. Modifications to the VM image were made to account for different boot devices, networking configuration and user, but these changes were very minimal. Each container/VM was configured to acquire an IPv4 address from lxd-bridge (running in the parent container) and launch Nginx (via systemd) serving a partial mirror of linuxcontainers.org (did not include “Download” content).
Environment
All tests were run in a LXD container using the same LXD image (fully purged between separate tests) for the top-level container. The container’s memory limit was set to 8gb with swap disabled for the container. CPU was limited to a single core to prevent the system from being unresponsive. Devices were added to the container as necessary (i.e. bind mounted), including /dev/kvm, /dev/net/tun and /dev/vhost-net for QEMU, and /dev/zfs for LXD (see LXD Issues below).
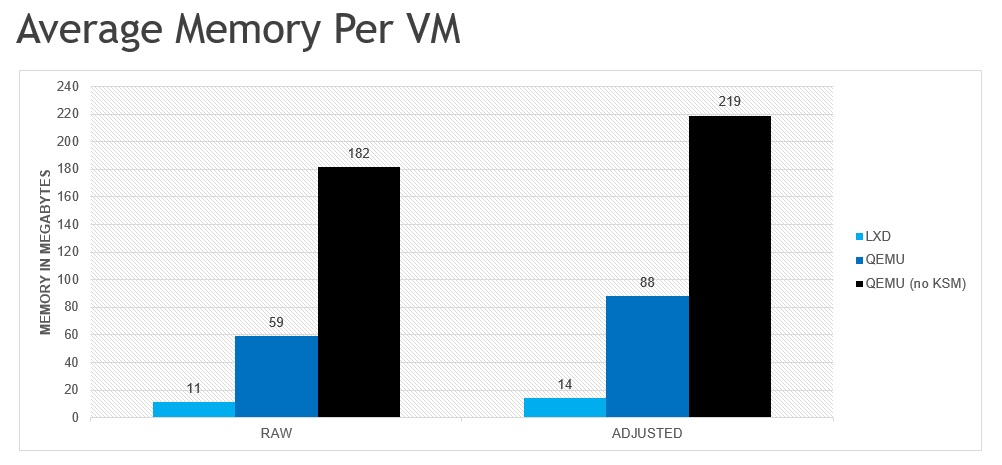
Memory consumption was calculated by running “free –m” after launching each VM/container bunch. The first 10 containers/VMs were created sequentially, with subsequent containers/VMs launched in groups of ~50. The memory consumption measurement was rechecked until the result stabilized for ~10 seconds.
Synopsis RAW is the unadjusted memory consumption as measured by the calculating free’s “used” delta. ADJUSTED incorporates the estimated overhead of memory consumption by the kernel that is directly related to the container/VM (see Caveats section for more details).
Caveats This comparison does not attempt to profile the real world usage model for system containers, it is only intended to show the approximate overhead of LXD containers versus qemu-lite VMs. Software installation/updates, variance in workloads and other aspects of long-running containers/VMs are expected to significantly affect the density in production environments.
All numbers should be taken with a grain of salt, though rough comparisons between each case should be in the right ballpark. The current cgroup memory accounting does not correctly handle kernel allocations. The RAW usage numbers are reported from inside the LXD container and do not account for all kernel allocations. Kernel Same-Page Merging (KSM) is especially problematic as it involves a large amount of tracking in the kernel that is not correctly reflected in the container’s memory usage. The amount of estimated overhead is incorporated in the ADJUSTED portion of the chart. The estimated overhead was calculated by comparing usage reported by the container to the usage delta observed on the host when stopping the parent container. For example, stopping the container in the QEMU+KSM case freed 12GB total, even though the container only reported using 8GB. Running all tests on bare metal (not in a container or VM) would provide the most accurate data, but for a rough analysis the container approach should suffice (and saved my bacon as I had to resort to nuking the container many times for various reasons).
Analysis The density ratio from LXD-to-Qemu is between 5:1 and 7:1, depending on whether or not perceived kernel allocations are included in the memory usage calculation. As expected, this ratio is similar to the density ratio of Docker-to-ClearContainer.
Kernel Same-Page Merging is critical to achieving advertised base density for Qemu-Lite! Without KSM enabled, each Qemu-lite instance consumes nearly 20x the amount of memory as an equivalent LXD instance!
Qemu Issues KSM requires a fair number of system CPU cycles to merge pages. Tuning KSM isn’t strictly necessary but is definitely benefitial. For example increasing pages_to_scan to merge pages more quickly and/or dynamically enabling/disabling KSM, e.g. enable scanning only after launching a VM.
LXD Issues Needed to use ZFS for storage, immediately ran out of disk space with DIR. Nested ZFS requires privileged container reusing existing ZFS pool, i.e. it’s a hack.
Even with ZFS storage, disk space is an issue on development systems. For example, package caching (almost) immediately consumes ~55mb per container, and so launching hundreds of containers requires a sizeable ZFS pool or disabling package caching and auto-upgrades in the reference images. Storage for production systems should be less of an issue as procuring 10tb+ per system to should not be an issue, allowing for 20gb+ per container.
ZFS ARC is extremely aggressive by default (RAM - 1GB allowed!!!). Running out of free/available memory due to ARC’s caching will cause a lot of thrash.
ZFS system overhead can be problematic; thrashing due to ARC results in high CPU consumption in the host.
Pinning all containers to CPU!=0 greatly reduces the amount thrashing, enabling containers to spin up faster.
Exhausted inotify allocations, nginx wasn’t being started on some containers.
sudo sysctl -w fs.inotify.max_user_instances=65536 sudo sysctl -w fs.inotify.max_user_watches=65536
Future Work Automatic persistence of filesystem changes to disk needs to be added to the Qemu/KVM flow. The Qemu command used for this comparison exposes the base image to the VM using the NVDIMM option to present a memory-backed device to the VM. Since the image is shared amongst all VMs, Qemu is configured to not persist changes back to the original image in order to avoid corruption of the base image. To better match LXD’s environment, a ZFS pool should be allocated for the Qemu flow. This would provide the ability to clone the base image and create per-VM images, allowing automatic persistent of filesystem changes to the VM’s unique image while (in theory) retaining the goodness of KSM (base image data should be mergeable).
Image
The base image for each container/VM is an Ubuntu 16.04 server image pulled from the LXD ubuntu: repository. The Qemu image was created by exporting the LXD image and extracting it into an ext4 filesystem. Modifications to the VM image were made to account for different boot devices, networking configuration and user, but these changes were very minimal.
Environment
In all tests, the client, Vegeta, was run in the native environment and was pinned to CPU0 and CPU1 using cgexec and the cpuset cgroup. The server was similarly pinned to CPU2 and CPU3 for all tests, using cgexec on the server binary for native, cgexec on qemu for qemu-lite, and LXD’s CPU pinning (same cpuset usage under the hood) for the LXD test. No cgroup restrictions were used for memory or I/O in any test.
All environments were configured with “ulimit –n 50000” to avoid failures due to file handle restrictions (high request rates open up a lot of sockets).
Network
LXD and Qemu instances were run on a bridge network, with IPs acquired via DHCP, managed by the lxd-bridge daemon. Qemu was configured to use a virtio driver.
Disk
The base filesystem is ext4 on a Samsung evo 850 SSD. LXD is using a 20gb ZFS pool on top of the base filesystem. Qemu is using a non-persistent NVDIMM device.
Client
Vegeta is a HTTP load testing tool written in Golang, whose goal is to create a sustained load, i.e. fixed number of requests per second, for a specified duration. To maintain the desired request rate, Vegeta will spin up additional workers as needed, e.g. if existing workers are stalled waiting for responses. Vegeta was extended to add a second mode for fixing the number of requests and workers (as opposed to rate and duration). For downloads, Vegeta copies the request body to /dev/null.
Server
The server is a minimalistic Golang HTTP server based on the Gorilla Mux router. Three APIs are exposed: DOWNLOAD, UPLOAD and TRANSCODE. For UPLOADs, the server can be told to do one of the following a) copy request body to disk, b) copy request body to temp file and immediately delete or c) copy request body to /dev/null (discard). Behaviors (a) and (b) were used for the tests.
Synopsis
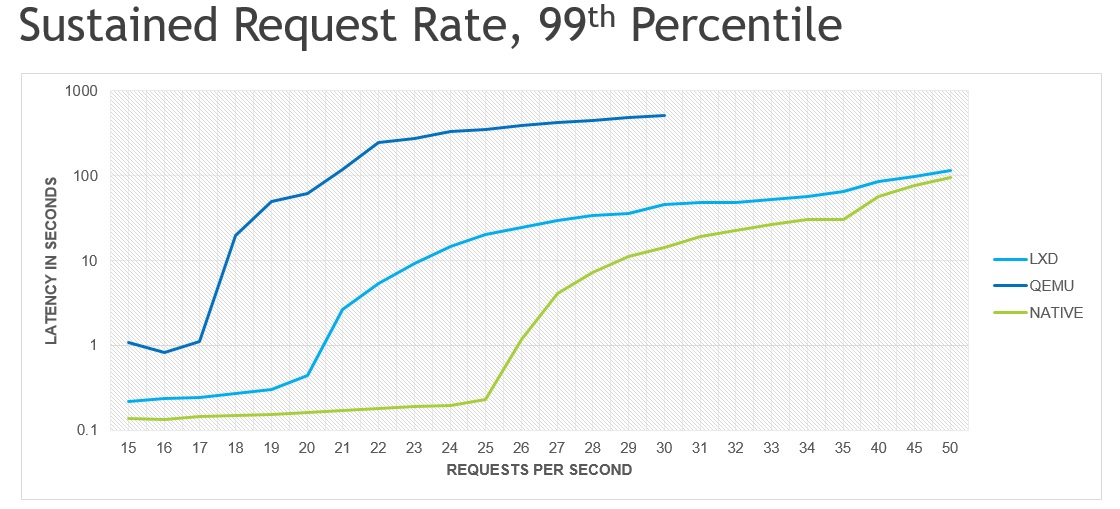
This graph shows the latency, in seconds, of download requests in the 99th percentile; that is, the latency in which 99% of all requests are being handled. A separate run of Vegeta was done for each request rate, with each run lasting 60 seconds. The download target is a set of 10 video files, ranging in size from 26mb to 186mb, which targets selected by a basic round robin algorithm. To sustain the desired request rate, Vegeta spins up worker goroutines as needed. Note: The Y-axis is logarithmic.
The 99th percentile was chosen over the MEAN, 50th percentile, 95th percentile and MAX, as the 99th percentile provides a clear differentiation of performance without being overly affected by outliers, e.g. requests that take significantly longer than all other requests. The graphs for other measurements follow very similar curves, i.e. they show the same fundamental result, but usually with less clarity and/or consistency.
Caveats
Production environments are highly unlikely to use a software bridge for system container networking, especially in a demanding environment such as video streaming. The performance comparison relative to the native baseline should be viewed as a sort of “worst case scenario”, i.e. these are the numbers you’ll achieve with little to no optimization effort.
Analysis
As is probably expected, native performance is significantly better than LXD, which in turn is significantly better than Qemu. The loss in performance is almost certainly due to overhead in the software bridge (LXD and Qemu) and in the virtio driver (Qemu). Measuring performance by overloading to the point of failure provides a powerful graphic as it is trivial to translate these results to “here are the number of machines you’ll need to handle X amount of traffic”.
Synopsis
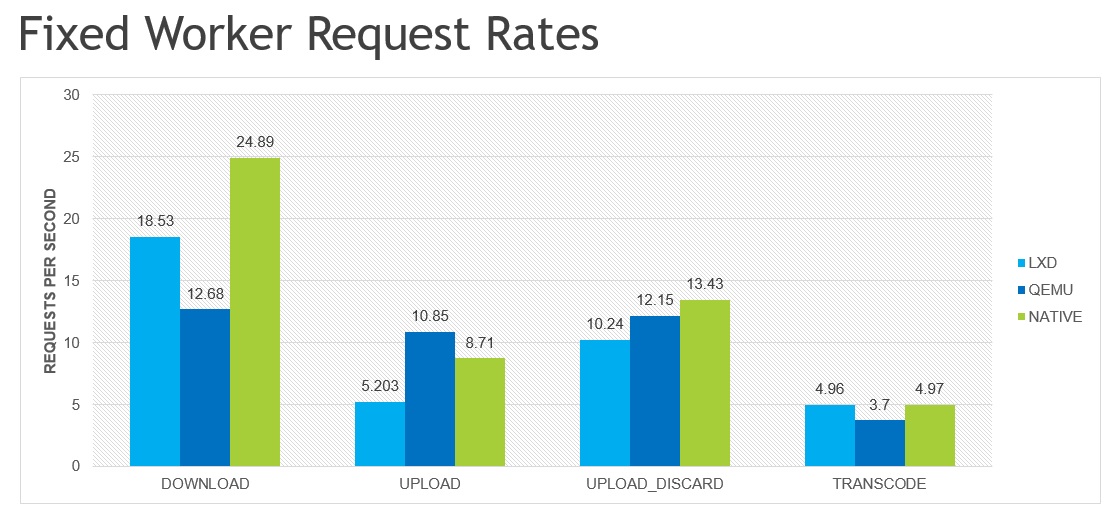
This chart shows the number of requests per second that was achieved with a fixed number of workers and requests.
For download and upload, two Vegeta workers were used (one per available hardware thread) to perform 10,000 requests. The payload for the each requests is picked from a set of 10 video files, ranging in size from 26mb to 186mb, with targets selected by a basic round robin algorithm. In the DOWNLOAD and UPLOAD tests, the payload is copied to a temporary file that is immediately deleted once the request is completed. The UPLOAD_DISCARD test is identical to the UPLOAD test except that it copies the data to /dev/null (or whatever Golang’s underlying equivalent is) and so does not incur the big disk write access.
For transcode, a single Vegeta worker is used so that only one transcode request is in-flight at any given time. FFmpeg, the tool used for transcoding, will use all available CPUs, and so multiple in-flight requests would simply muddy the results as the CPU would become severely overloaded. A total of 40 transcode requests are made (4 x 10 videos), with no data transferred between client and server (videos already “uploaded” to server). Note: the request rates for transcode were adjust to fit the Y-axes. The runtime for the transcode test is over five hours, e.g. the true request rate is actually ~0.001988 requests per second. To fit on the same graph as DOWNLOAD/UPLOAD, the transcode request rates were multiplied by 2500.
Analysis
As opposed to overloading the system, which is a sort of all-encompassing benchmark, each test highlights a specific deficiency or proficiency, as effectively serializing the requests helps isolate one or two system resources.
The TRANSCODE chart is not all that interesting, as it’s fairly common knowledge that containers have essentially zero CPU overhead, while VMs most definitely do not. The associated cost savings containers can bring for CPU intensive workloads is notable, but again, shouldn’t be big news to anyone familiar with VMs and containers.
The DOWNLOAD chart is mildly interesting, and really highlights the high base latency of Qemu’s network.
The UPLOAD and UPLOAD_DISCARD charts are very interesting. The delta between the two UPLOAD tests highlights 1) the performance benefit Qemu is getting from NVDIMM-based “disk” and 2) the performance cost of LXD containers being backed by a ZFS pool on top of an ext4 disk.
http://blog.csdn.net/ustc_dylan/article/details/6784876 http://blog.csdn.net/ustc_dylan/article/details/6807731